Software:Pep3D
From SPCTools
| Revision as of 18:42, 9 April 2007 Jtasman (Talk | contribs) ← Previous diff |
Current revision Jtasman (Talk | contribs) |
||
| Line 1: | Line 1: | ||
| - | This software is included in the current TPP distribution. | + | ==Getting the software== |
| + | '''This software is included in the current [[Software:TPP|TPP]] distribution.''' | ||
| - | Reference: Li X-J, Pedrioli PGA, Eng J, Martin D, Yi EC, Lee H, Aebersold R. (2004) "A tool to visualize and evaluate data obtained by liquid chromatography / electrospray ionization / mass spectrometry." Anal Chem 76:3856-60. | + | ==In a nutshell== |
| + | View LC-MS and LC-MS/MS results in a 2D mz vs. time plot. | ||
| + | |||
| + | ==More detail== | ||
| + | If identifications are available via an INTERACT or pepXML Viewer interface with PeptideProphet results, sequencing attempts and identification quality are overlayed on the plot; each spot is then a hyperlink to the ms/ms spectrum and identification. The results can be used to evaluate data quality among its many applications. | ||
| + | |||
| + | ==Reference== | ||
| + | Li X-J, Pedrioli PGA, Eng J, Martin D, Yi EC, Lee H, Aebersold R. (2004) "A tool to visualize and evaluate data obtained by liquid chromatography / electrospray ionization / mass spectrometry." Anal Chem 76:3856-60. | ||
| [http://tools.proteomecenter.org/publications/Li-Pep3D.pdf download PDF] | [http://tools.proteomecenter.org/publications/Li-Pep3D.pdf download PDF] | ||
| + | |||
| + | The link to the supplemental information referenced in the manuscript is incorrect. Here's the [http://pubs3.acs.org/acs/journals/supporting_information.page?in_manuscript=ac035375s correct link to the supplemental information]. | ||
| + | |||
| + | |||
| + | [[image:pep3d.jpg]] | ||
Current revision
Contents |
Getting the software
This software is included in the current TPP distribution.
In a nutshell
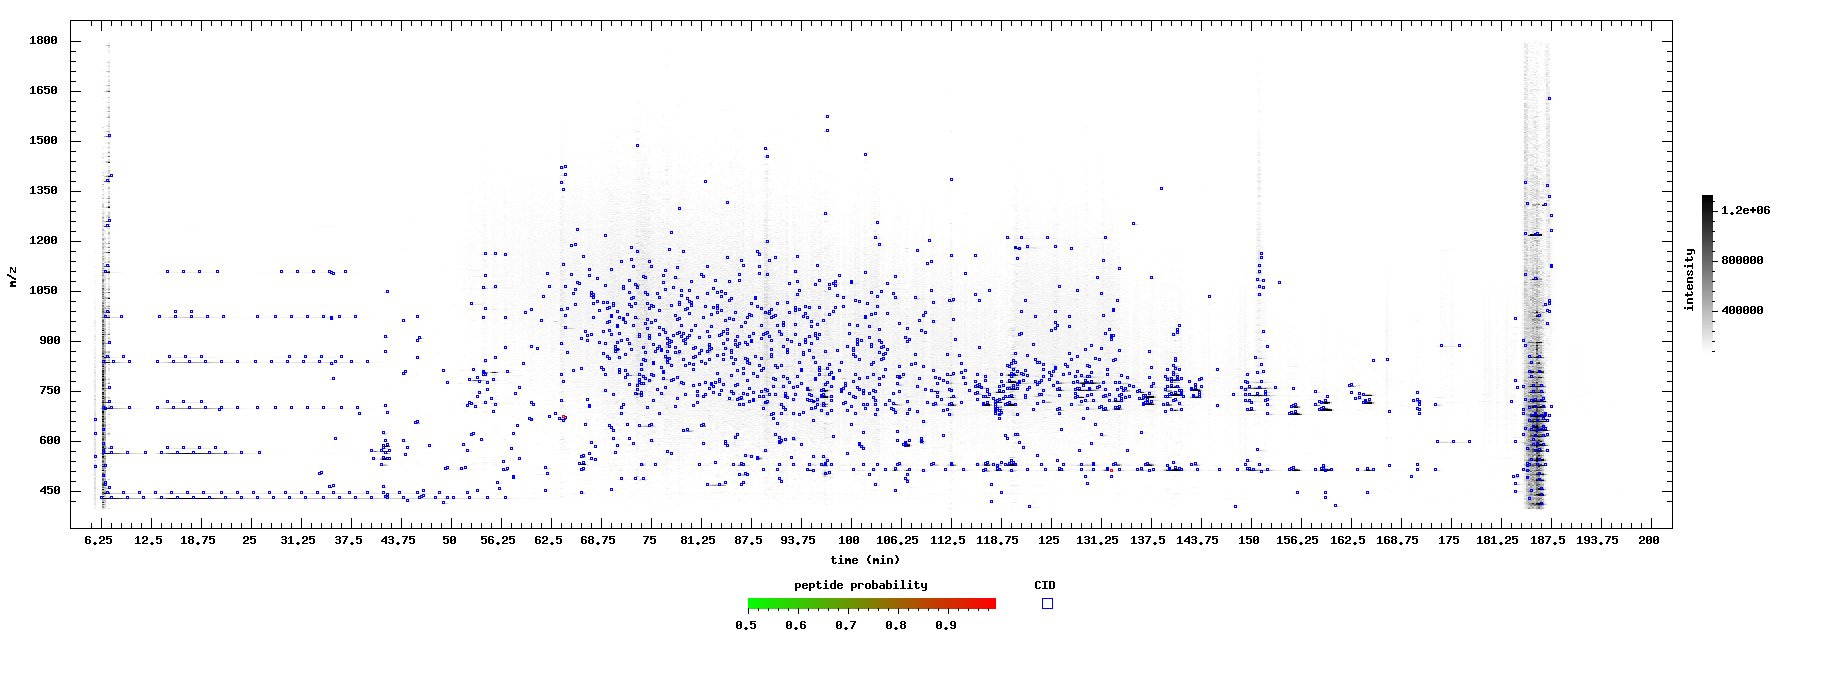
View LC-MS and LC-MS/MS results in a 2D mz vs. time plot.
More detail
If identifications are available via an INTERACT or pepXML Viewer interface with PeptideProphet results, sequencing attempts and identification quality are overlayed on the plot; each spot is then a hyperlink to the ms/ms spectrum and identification. The results can be used to evaluate data quality among its many applications.
Reference
Li X-J, Pedrioli PGA, Eng J, Martin D, Yi EC, Lee H, Aebersold R. (2004) "A tool to visualize and evaluate data obtained by liquid chromatography / electrospray ionization / mass spectrometry." Anal Chem 76:3856-60. download PDF
The link to the supplemental information referenced in the manuscript is incorrect. Here's the correct link to the supplemental information.


