PeptideAtlas:Chromosomal coverage
From SPCTools
When using the Browse Proteins function in PeptideAtlas, one can generate a graphical depiction of the chromosomal coverage for an atlas build. In order to get such a depiction, one must restrict the listing to proteins from a single chromosome on a human build.
Instructions
- Go to www.peptideatlas.org
- Click "go" on the search box (leaving the search box blank)
- At the menu at the top of the page hold your mouse cursor over "Queries", and from the new menu that appears select "Browse Proteins"
- In the option box labeled "Chromosome" type the chromosome number you would like to search
- If you would like to zoom in on a section of the chromosome use the "Start in Chromosome" and "End in Chromosome" option boxes. You can fill in one, both, or neither box. Use < and > symbols to insert base pair start/end coordinates. If you want the entire chromosome just leave the "Start in Chromosome" and "End in Chromosome" option boxes empty.
- You must input a chromosome number to view the graph. Having it as part of the genetic locus name is not enough.
- For example, to show the section of Chromosome seven between 30 million and 50 million base pairs enter "7" into "Chromosome", ">30000000" into "Start in Chromosome", and "<50000000" into "End in Chromosome".
- To adjust the level of selectivity for the proteins in the build use the "Presence Levels" and "Redundancy" option boxes.
- The option of "Canonical" and "No redundant relationships" is the most restrictive option set. Choosing "Identical" and/or "Indistinguishable" instead of "No redundant relationships" provides repeat proteins.
- The Swiss-Prot protein is the canonical protein for almost every protein.
- If you don't have a selectivity preference you can click the bottom blank option row.
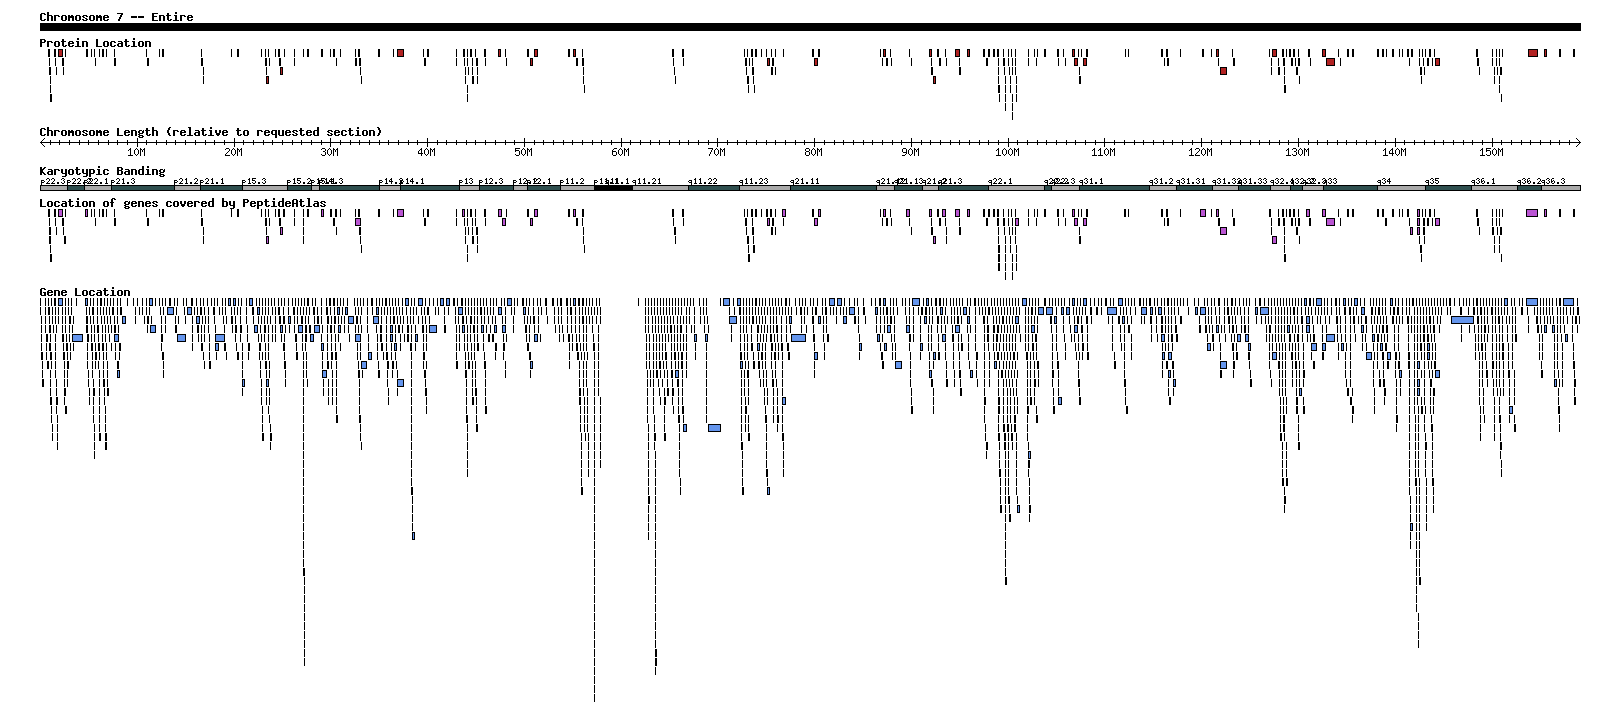
Here is an example of what the graphical depiction looks like. This happens to be all of Chromosome 7. A larger version of the file can be found here.

Interpreting the graphical depiction
The graphical depiction has a title bar and five tracks of information. The title bar shows which chromosome is being viewed, and what portion of the chromosome is shown. The five informational tracks are from top to bottom "Protein Location", "Chromosome Length", "Karyotypic Banding", "Genes covered by PeptideAtlas", and "Gene Location".
"Chromosome Length" is a ruler so that you can know at which base pair a protein or gene is located. Be warned that the numbers on its tick marks are relative to the portion of the chromosome being viewed - it will start at zero no matter what you're viewing. In order to find the true base pair location of a point on the ruler, add the number of base pairs that the viewed portion begins with. For example, if you're viewing a portion between 30 and 50 million, the spot on the ruler that says 4 million is in reality 34 million base pairs from the beginning of the chromosome.
"Karyotypic Banding" is another form of ruler, except that it uses chromosomal banding instead base pairs. It is useful when comparing with outside information that gives location in genetic locus format, or when looking at a subsection of a chromosome. Unlike the base pair ruler, this one does not change when you zoom into a section of a chromosome.
The other three tracks depict the location of proteins, genes, and those genes that contain at least one PeptideAtlas protein. The proteins and genes are drawn as bars with length based on the length of the protein/gene in base pairs. The longer the protein/gene, the longer the bar. Staggering of the bars happens when they are so close to one another that if shown in a single row it would be nearly impossible to distinguish all individual bars.
The "Protein Location" track shows the positions of all the Ensembl, IPI, and Swiss-Prot protein sequences returned by the Browse Proteins query. The "Gene Location" track shows all genes in the requested portion of the chromosome drawn by location. The "Genes covered by PeptideAtlas" track shows which genes contain at least one of the proteins. Contain is defined as the start and end coordinates of the protein are between the start and end coordinates of the gene. This track should show completeness of an atlas build in a given region, because if PeptideAtlas contains all proteins, then all genes should be represented, and thus both gene tracks would look the same.

